Qualified Remodeler helps independent remodeling firms to survive, become more professional and more profitable by providing must-have business information, namely best business practices, new product information and timely design ideas.
Issue link: https://qualifiedremodeler.epubxp.com/i/149260
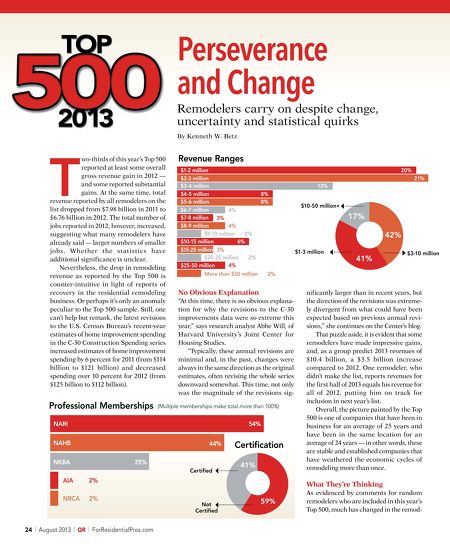
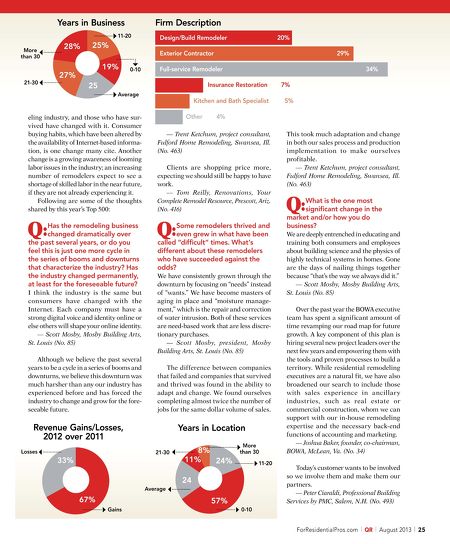
Perseverance and Change Remodelers carry on despite change, uncertainty and statistical quirks By Kenneth W. Betz T wo-thirds of this year's Top 500 reported at least some overall gross revenue gain in 2012 — and some reported substantial gains. At the same time, total revenue reported by all remodelers on the list dropped from $7.98 billion in 2011 to $6.76 billion in 2012. The total number of jobs reported in 2012, however, increased, suggesting what many remodelers have already said — larger numbers of smaller jobs. Whether the statistics have additional significance is unclear. Nevertheless, the drop in remodeling revenue as reported by the Top 500 is counter-intuitive in light of reports of recovery in the residential remodeling business. Or perhaps it's only an anomaly peculiar to the Top 500 sample. Still, one can't help but remark, the latest revisions to the U.S. Census Bureau's recent-year estimates of home improvement spending in the C-30 Construction Spending series increased estimates of home improvement spending by 6 percent for 2011 (from $114 billion to $121 billion) and decreased spending over 10 percent for 2012 (from $125 billion to $112 billion). Professional Memberships Revenue Ranges $1-2 million $2-3 million $3-4 million $4-5 million 8% $5-6 million 8% $6-7 million 4% $7-8 million 3% $8-9 million 4% $9-10 million 2% $10-15 million 6% $15-20 million 3% $20-25 million 2% 4% $25-50 million More than $50 million "At this time, there is no obvious explanation for why the revisions to the C-30 improvements data were so extreme this year," says research analyst Abbe Will, of Harvard University's Joint Center for Housing Studies. "Typically, these annual revisions are minimal and, in the past, changes were always in the same direction as the original estimates, often revising the whole series downward somewhat. This time, not only was the magnitude of the revisions sig- (Multiple memberships make total more than 100%) 54% NAHB 44% NKBA 25% Certified AIA 24 2% Certification 41% 2% NRCA August 2013 QR ForResidentialPros.com 21% 13% $10-50 million+ 17% 42% $1-3 million 41% $3-10 million 2% No Obvious Explanation NARI 20% nificantly larger than in recent years, but the direction of the revisions was extremely divergent from what could have been expected based on previous annual revisions," she continues on the Center's blog. That puzzle aside, it is evident that some remodelers have made impressive gains, and, as a group predict 2013 revenues of $10.4 billion, a $3.5 billion increase compared to 2012. One remodeler, who didn't make the list, reports revenues for the first half of 2013 equals his revenue for all of 2012, putting him on track for inclusion in next year's list. Overall, the picture painted by the Top 500 is one of companies that have been in business for an average of 25 years and have been in the same location for an average of 24 years — in other words, these are stable and established companies that have weathered the economic cycles of remodeling more than once. What They're Thinking Not Certified 59% As evidenced by comments for random remodelers who are included in this year's Top 500, much has changed in the remod-